
History
Claude creates charts inside the conversation
From 12 March 2026, Claude could create interactive charts and diagrams inside its answers.
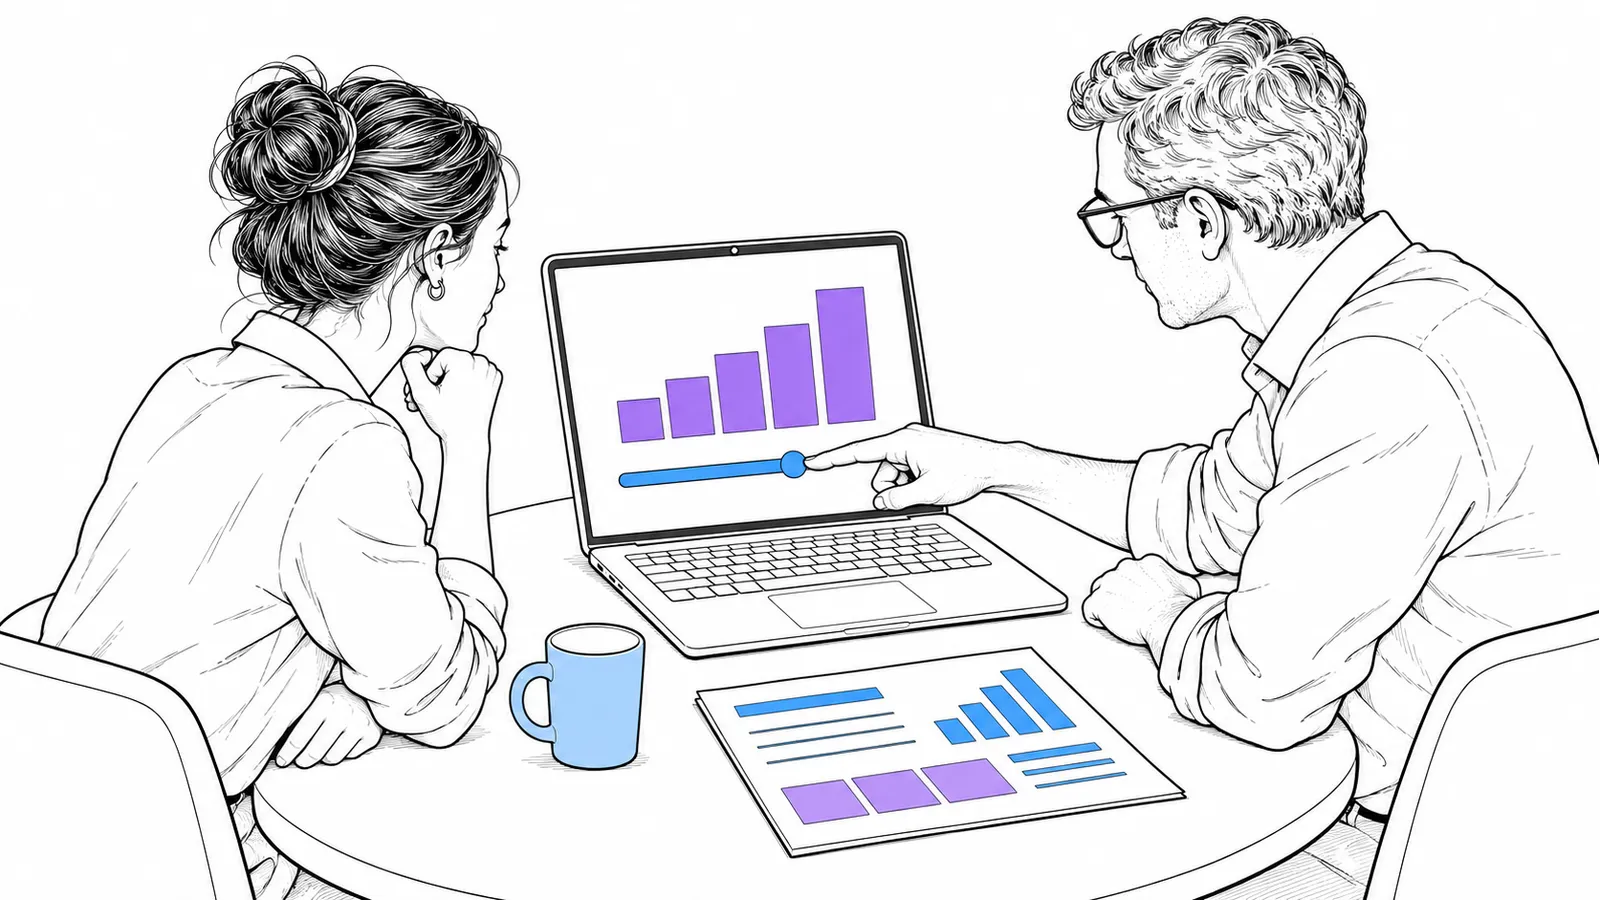
Some questions become clearer when you can look at something and change it. On 12 March 2026, Anthropic said Claude could create interactive charts, diagrams and other visuals in its answers. The result appeared inside the conversation itself. This made the form of an answer part of working with the assistant.

That mattered for explanations. A chart lets you discuss which difference you want to see, for example. A diagram offers another way in than a long paragraph. The release did not mean the displayed data was automatically correct. You need to assess the image and its underlying data separately.
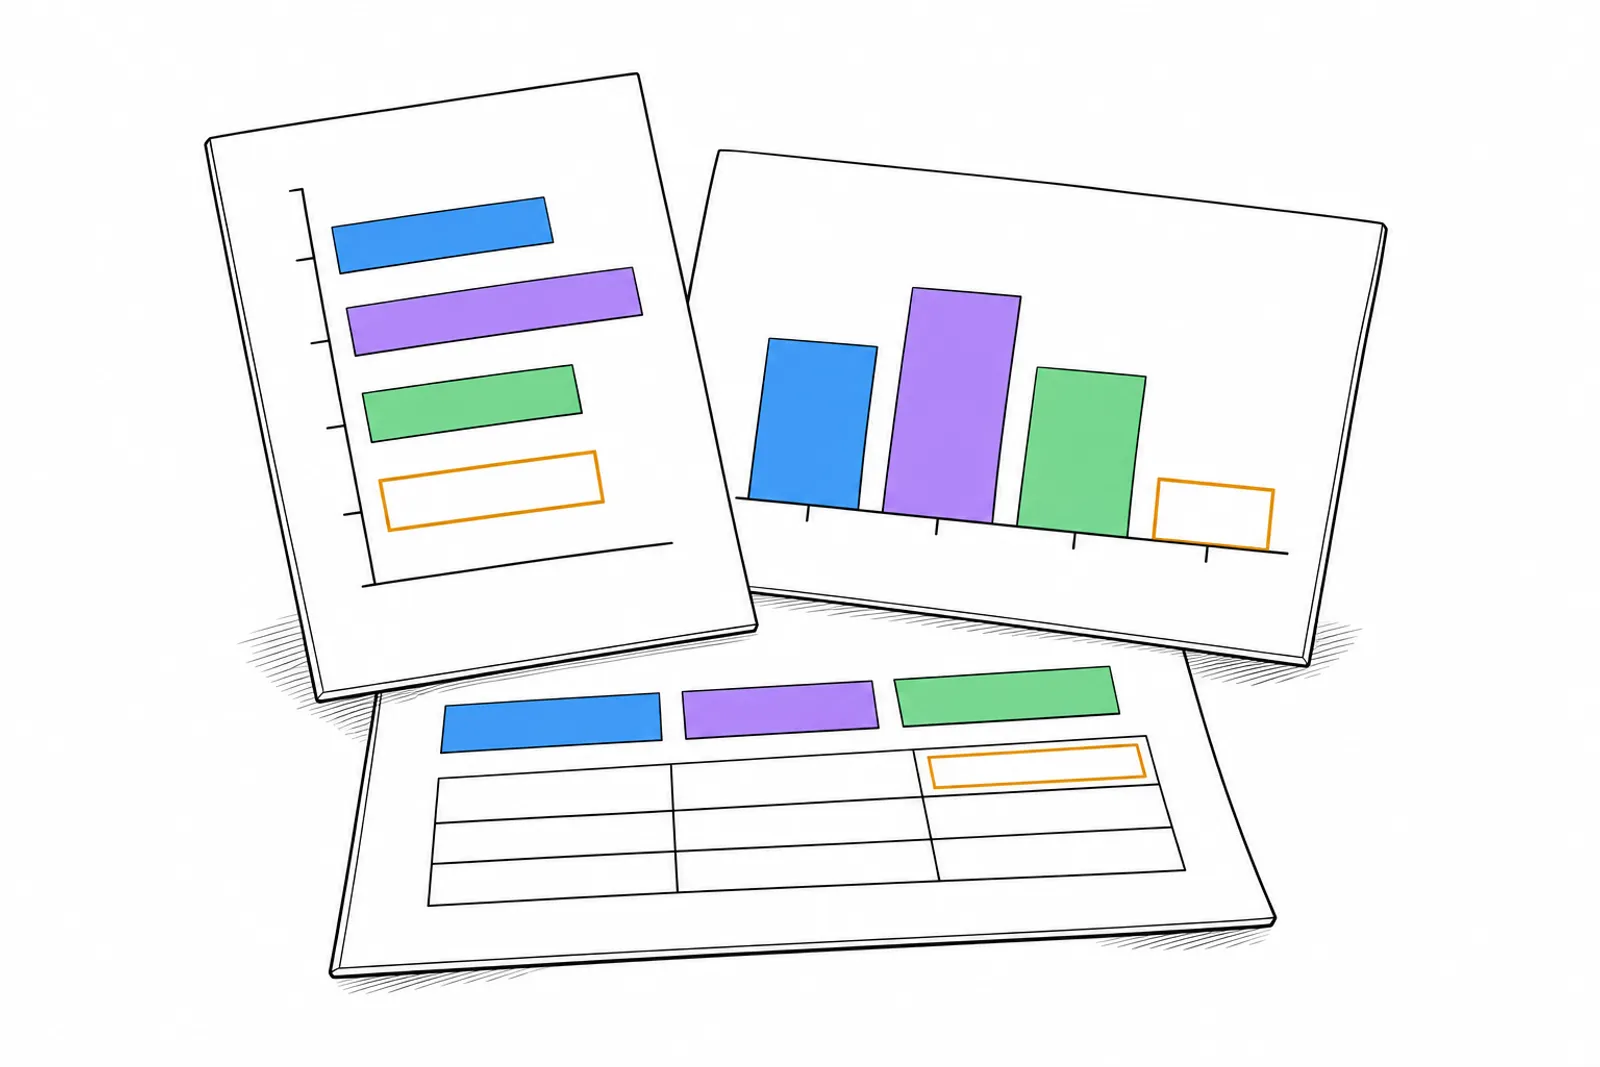
For a small business, an exercise with public figures is a useful starting point. Request a chart with clear units and a visible source. Check whether a missing number remains recognisable as missing. Then request a different layout and check whether the meaning stays the same.
Use the visual to clarify a question together before basing a decision on it. Want to make a complicated business process understandable? Discuss your explanation with Denkbaar.